Saturday, May 26, 2012

Review: Jeff Rubin on The End of Growth, Capilano University, Vancouver, 24/05/2012

Last night I went to see Jeff Rubin speak on his new book, The End Of Growth. As the former Chief Economist for CIBC World Markets he brings an intimate knowledge of financial markets and how they work to the peak oil/end of growth community populated by other venerable thinkers such as Richard Heinberg, Chris Martenson and John Michael Greer.

Rubin is a formidable speaker and for someone like myself who has been interested in these issues for a number of years it was exciting to see the auditorium close to sold out. This is a message that needs to be heard and I thank Jeff Rubin for taking his views on the road and speaking to people about them. He is also self-deprecating and humble, often referring to how he left CIBC World Markets due at least in part to the global financial crisis and the vast effects that had on the world.

Rubin spoke  for roughly forty minutes followed by a forty minute question session. He covered many topics, mainly surrounding the global financial system, oil and gas, the Euro situation, the United States and of course Canada. I have collated his main points below under the relevant headings. Apologies to Jeff Rubin if any of the figures I recorded are incorrect.

The European Crisis 

  • My question to Jeff Rubin during question time was this: Why is austerity the go to strategy in the Eurozone? If you were in charge what policies would you put in place to get Greece etc out of the current quagmire? Rubin predicts that Greece will default on loan repayments within the next 4-5 months and believes this is the only option left. Spain, Portugal and Italy will probably not be far behind (Portugal, Italy, Greece and Spain are referred to as the PIGS). For the last 200 years Greece has been in default 50% of the time so it is not anything particularly new for them. Germany wants to keep the PIGS in the monetary union because it lowers the Euro enough to make German exports attractive to overseas buyers. If the PIGS are forced to leave the monetary union German exporters will have to be bailed out. The big question is if the PIGS leave the monetary union will they also be forced to leave the Euro free trade zone?
  • Due to the interconnectedness of the global financial systems any defaults in Europe will be felt by absolutely everyone. It is likely that your bank has interests connected to a bank in somewhere like France that has interests in either Portugal, Italy, Greece or Spain.

The Global Financial System

  • The global financial system (GFC) remains relatively unchanged since the 2008 global financial crisis apart from losing a few major players such as the Lehman Brothers and Bear Sterns. Rubin believes we are at the beginning of another financial crisis right now and that in the aftermath financial systems will finally be reformed as they should have been after 2008.
  • Huge deficits and stimulus bailouts are no substitute for cheap oil because they don’t lead to long term growth.

General Predictions

  • Youth will stay at home longer until their mid 20s and people will work until they are much older. The time of leisurely retirements is over.
  • The global trade system will be greatly reduced as oil becomes more expensive. We will see the relocalisation of industry with agriculture and manufacturing producing much closer to markets.
  • The tax base will no longer grow and so governments will have to plan on little to no economic growth when making policy decisions.
  • Government will increasingly contract out services to private companies who can provide services at a cheaper rate in an effort to decrease government spending.
  • Real estate prices in cities and downtown areas will rise and outer suburbs may revert back to agriculture as people can no longer afford to commute large distances to and from work.
  • Education will shift to more practical skills that involve making things ourselves. The FIRE services (Finance, Insurance and Real Estate) will still exist but in a greatly reduced role.
  • Tourism will become much more localised. Air travel will revert back to what it was like in the 1960s and 1970s where ticket prices were four times higher than today.

Energy/Consumption

  • Energy consumption is easily reducible: Denmark reduced carbon emissions by 13% to 1990 levels as part of Kyoto commitments, in contrast Canada saw a 30% increase in carbon emissions over the same period (much of this due to the Alberta tar sands) and then left the Kyoto agreement.
  • Denmark's saw this carbon reduction with 80% of its electricity coming from coal with the other 20% coming from wind. This was due to high electricity prices meaning when it gets cold they put on more clothes rather than turning up the air conditioning. There is also a 180% surcharge on buying a car so many people either walk, cycle or use public transport.
  • Before the Japanese earthquakes last year Japan produced 30% of its electricity from nuclear power. Today that figure is 0% after shutting down all of its 34 nuclear power plants due to safety concerns.
  • Oil is four times as energy dense as natural gas making it much more viable as a transport fuel. The reason the price differential between oil and natural gas is not arbitraged is because natural gas is a very poor substitute for oil as a transit fuel.
  • As for the long term viability of shale gas it is worth watching the future of Chesapeake Energy, the largest investor in shale gas, which is currently in huge financial trouble.

Canada

  • Canada has seen a transformation into a petro-state over the last decade.
  • Canada has very low population density and so faces a unique set of problems.
  • The financial and power fault lines will increasingly be between the haves and have nots in terms of oil producing land. Ontario will be a big loser and the power and financial base will increasingly shift to where the oil is in Alberta and Newfoundland.
  • Mark Carney, the governor of the Bank of Canada, advises the public not to get mortgages but then keeps interests rates low that make mortgages attractive. This is akin to surrounding an overweight person with unhealthy food and telling them not to eat anything.
  • British Columbia would be foolish to accept the TransCanada pipeline to ship Albertan oil to China. It would be absorbing the environmental costs of the pipeline with little economic benefit to the area. Any spill would be devastating to marine life in the area and the surrounding economy.

Population

  • Japan is an opportunity to be studied as it has had a declining population for the last decade. It can be treated as a microcosm for where the rest of the world is heading.
  • Because economic growth is directly linked to lower birth rates, in an age of zero growth it is essential to focus on female education to reduce birthrates.
  • Hungry people have three choices: rebel, migrate or die. With lower energy use per capita migration is becoming increasingly difficult. The Arab Spring was in Rubin’s view Malthus come true. A huge population with very few economic options rebelled and overthrew a number of governments.

Some Policy Solutions

  • Job share policies such as seen in Germany are better than government stimulus because it keeps unemployment low by keeping people in work, albeit at reduced hours. The benefit of this is increased leisure time and a steady tax base.
  • There should have been massive investment in public transport after the GFC instead of bailing out car companies. Massive investment in public transport is essential.
  • Bank regulation is essential. Especially decoupling banks from investment firms which have been a major cause of problems since deregulation in the 1980s. Privatised benefits and socialised losses of banks is unacceptable and must be stopped.
  • Free money policies need to go.

Silver Linings for Climate Change

  • Scandinavian countries have some of the lowest consumption levels in the West but the highest levels of happiness.
  • As the world economy slows carbon emissions will also be reduced. This means that the emissions projections from the IPCC will probably never eventuate which will hopefully alleviate the worst of climate change.
  • Coal prices are already over $100 a tonne. Most climate change projections include massively increasing coal use although this is unlikely given where the global economy is heading. Where will all this coal come from and who can afford to pay those kinds of prices?
  • In 2009 U.S. carbon emissions fell not due to any government policy but due to zero growth.
  • When the USSR fell carbon emissions fell by 30% due to the massive contraction of the economy.

Thursday, May 24, 2012

Drill, Baby, Drill! More Drilling Doesn't Necessarily Mean More Oil

The United States has a problem. An oil problem. No matter how many wells are drilled oil companies just can't seem to raise production to anywhere near the figures required to reach the holy grail of energy independence.

Looking at the oil production data, active rigs in use and footage drilled over the last forty years it is clear that no matter how much investment is made are there just isn't the size and quality of oil producing fields left in the U.S. any more.

image

Figure 1: U.S. Crude oil production (including lease condensate) and active rig count, January 1973 to January 2012.

Various news items and opinion pieces have announced that the United States is entering an exciting new era of energy independence. Figure 1 shows that the truth is a bit more sobering. We can see that over the last 40 years the overall trend for crude oil production has been steadily decreasing. There are a few anomalies however. In the late 70’s and early 80’s the rig count climbed dramatically as a response to high global oil prices. This however only produced a very slight increase in oil production over the boom period. Once the bubble burst in 1985 crude oil production continued on its downward trajectory. Rig counts fluctuated wildly until the Asian recession in 1998, recover and then dip again after the Dot-com crash of 2000-2001 and recover again until the beginning of the global financial crisis (GFC) in 2008. This is where things get interesting. As the economy begins to recover after the GFC and rig counts begin rising, U.S. oil production begins rising for the first time in over 20 years. This is due largely to rigs coming online that employed hydraulic fracturing or fracking, the process that enabled oil companies to extract oil from previously marginal areas. 

This increase in oil production is what pundits have been hailing as a new era for U.S. energy independence. There are a number of reasons why this is overly optimistic and these will be explored below.

image

Figure 2: U.S. crude oil production (including lease condensate) and U.S. footage drilled for crude oil, natural gas, and dry exploratory and developmental wells (thousand feet), January 1973 to February 2012.  

Figure 2 shows footage drilled had been steadily increasing from the early 2000s but fell off during the 2008 financial crisis. Once the global economy began to recover drilling increased sharply to the highest numbers seen since the mid 1980s. The remarkable thing is this: even though drilling is at a 25 year high production has not followed suit. Since July 2009 the drilled footage has increased a whopping 105.5 percent but production has failed to follow increasing by only 7.6 percent. Clearly all is not well in the land of oil and gas.

image

Figure 3: Ratio of U.S. crude oil production (thousands of barrels per day) to active rig count, January 1973 to January 2012.

Figure 3 shows that for every active rig in the U.S. today roughly 2700 barrels of oil are produced. This is a far cry from the 5900 daily barrels per active rig at the beginning of 1973.

image

Figure 4:  Ratio of U.S. footage drilled for crude oil, natural gas and dry exploratory and developmental wells (thousand feet) to active rigs, January 1973 to January 2012.

Figure 4 shows that the ratio of footage drilled of all types to active rigs has steadily increased since 1998. This is a combination of both drilling deeper and less exploratory wells being converted into active rigs. It can costs hundreds of dollars per foot to drill so we can see that the U.S. is coming up against increasing inefficiencies with drilling to active rig conversion.

Figures 3 and 4 show that it is without a doubt that the fields being tapped today are of a far lower quality. This means far more capital must be invested in order to produce the same amount of oil as 40 years ago. With the U.S. and global economy still on very shaky ground it is questionable as to where this capital will come from. There are already concerns being raised over a labour shortage in the U.S. oil industry. 

Well Servicing Magazine reports that:

“There are just not enough experienced work crews to staff many more rigs coupled with various areas of the country that do not want drilling or servicing rigs working in their backyards.

No one knows how rig counts will react any more. There is only so much iron the oil patch can handle. Rigs and tubular goods cannot materialize that fast. There might be a gradual trend upward, but it’s a slow process. The reality is that rig counts can go down much faster than they can go up.”

So even if there was no looming labour and capital crisis how soon could the U.S. gain oil independence based on current growth figures?

image

Figure 5: Projected U.S. crude oil production (including lease condensate) based on he trend from January 2009 to February 2012.

The U.S. currently consumes 19,500,000 barrels of oil per day. If we assume that U.S. oil consumption stays the same it will take 80 years for the U.S. to reach oil independence based on the production trend from the last three years (Figure 5), unless the active rig count increases dramatically which as we have seen above is unlikely in the current economic climate. If the U.S. hopes to grow its economy in any real sense (financial abstractions in the tertiary economy don’t count) it is clearly a ridiculous assumption that  oil consumption will not grow at the same time.

As with all future predictions only time will tell. But I am willing to bet that the only way that the U.S. will gain oil independence is by the economy contracting and jobs being lost. This is clearly not a winning platform for politicians to gain votes and so we will continue to see these Polyannaish statements based on little more than hope that the U.S. is on the brink of an energy revolution. The hard facts are more difficult to argue with but that won’t stop those trying to gain office and favour with the oil industry from promoting the idea of business as usual. Let’s hope they wake up before things get really bad.  

Wednesday, May 2, 2012

Building Highways To Nowhere: Transport Planners Refuse To Acknowledge Peak Oil

James Henderson at The Standard has kindly given permission to syndicate this post - the original is found here.

Holiday Highway Even Less Affordable

The case for the Puhoi to Wellsford Holiday Highway just got even worse. Before, officials reckoned it would return net benefits worth ten cents for every dollar spent. Now, the cost will equal the benefits – if traffic volumes double in 15 years. Problem is, traffic volumes in Northland are flat or falling in the Peak Oil Age.
It’s actually worse than that. The Puhoi to Warkworth segment will supposed have a 1.5 benefit:cost ratio if traffic volumes double (NZTA grades anything below 2 as a “low” return on investment) but Warkworth to Wellsford will have a BCR of 0.6. That’s right, for every dollar you sink into it, you get 60 cents worth back. That’s worse than what you can expect from SkyCity’s pokies. 

And both these crappy returns on investment are based on an unrealistic model for traffic growth. The amount of traffic matters because the main ‘benefit’ of the Holiday Highway is meant to be getting trucks from Northland to Auckland a few minutes faster, avoiding congestion they would face if the existing road had to handle double the traffic. But, if that congestion never materialises, neither does the value in having a new highway alongside the existing one. 

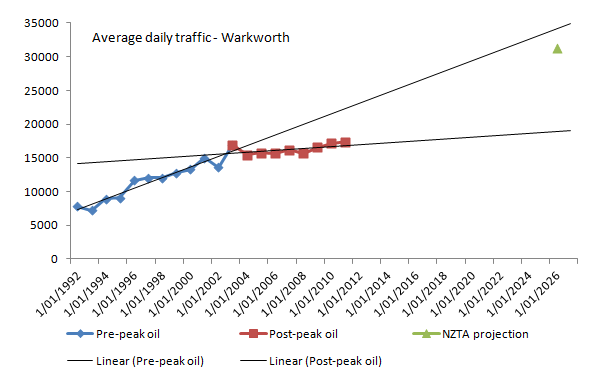
Here’s how traffic volumes are tracking in Warkworth with NZTA’s assumed 2026 volume for comparison to the trends: 


NZTA’s modellers seem to be working with a pre-peak oil model, wherein traffic growth will continue permanently and swiftly. In the real world, however, traffic volumes are stagnant. How bad does the BCR get if you cut the traffic volume in 2026 by 15,000 – in line with peak oil reality? 

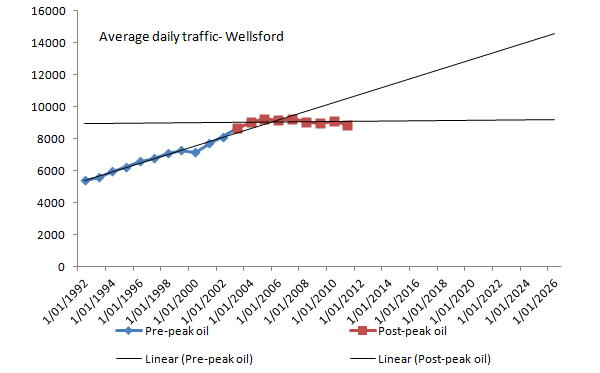
As for the second segment up to Wellsford. If you didn’t think it was a waste of money already: 


If you live up in Northland, it might be nice to have a billion dollar highway down from Wellsford to Warkworth, and a $760m one from there to Puhoi. But, we live in a constrained world – we don’t have money and resources for every option. The traffic volumes shown in those graphs are pretty typical for the main drag in a small town astride a state highway, and they’re not growing significantly. 

I’m afraid that highways that are only just worth their own cost of construction if miraculous traffic growth is assumed ought to be one of Bill English’s ‘nice to haves’. There are more effective uses for that money that will help more people.
Newer Posts Older Posts Home