Thursday, August 30, 2012

Don't Worry, There's Plenty of Oil

Reposted from Energy Bulletin. By Richard Heinberg. 

";" alt="">

In recent months we've seen a spate of articles, reports, and op-eds claiming that peak oil is a worry of the past thanks to so-called "new technologies" that can tap massive amounts of previously inaccessible stores of "unconventional" oil. "Don't worry, drive on," we're told.

But as Post Carbon Institute Senior Fellow Richard Heinberg asks in this short video, what's really new here? "What's new is high oil prices and … the economy hates high oil prices."

WE NEED YOUR HELP SHARING THIS VIDEO

  • Email the video to everyone you think needs to watch it
  • Share it through your social networks
  • Send it to your elected officials

We can fall for the oil industry hype and keep ourselves chained to a resource that's depleting and comes with ever increasing economic and environmental costs, or we can recognize that the days of cheap and abundant oil (not to mention coal and natural gas) are over.

Unfortunately, the mainstream media and politicians on both sides of the aisle are parroting the hype, claiming — in Obama's case — that unconventional oil can play a key role in an "all of the above" energy strategy and — in Romney's — that increased production of tight oil and tar sands can make North America energy independent by the end of his second term.

We need your help: Please share this video and help bring a dose of reality to the energy conversation.

The Script

Our civilization runs on oil.

It’s the cheapest, most energy-dense and portable fuel we've ever found. Nature required tens of millions of years to make petroleum, and we've used up the best of it in less than two hundred.

A little over a decade ago, eminent petroleum geologists calculated that global oil production would soon hit a “peak” and begin to decline, no longer meeting ever-rising demand. But oil industry spokesmen countered with the message, "Don't worry, there's plenty of oil!" and assured us that everything would be just fine.

So what actually happened? World crude oil production flat-lined in 2005, and oil prices went crazy. Wars erupted in the oil-rich parts of the world, and the global economy went into a tailspin. The term "Peak Oil" entered the lexicon.

The oil industry is now staging another PR counter-offensive. They're telling us that applying "new" technologies like hydrofracking to low-porosity rocks makes lots of lower quality, unconventional oil available. They argue we just need to drill more to produce more. Problem solved!

But wait. What's actually new here? Most of this technology has been around since the 1980s. The unconventional resources have been known to geologists for decades. What's new is high oil prices.

It’s high oil prices that make unconventional oil worth producing in the first place. It takes lots of money and energy, not to mention water, to frack low-porosity rocks. And the environmental risks are staggering.

How does the economy handle high oil prices? Well, it turns out the economy hates high oil prices and responds by going into recession. Which makes energy prices volatile, rendering the industry subject to booms and busts.

So, what’s the bottom line here?

Yes, there's still oil in the ground. We just can't afford it. In broad terms, the peak oil analysts were right. But the fossil fuel industry is winning the PR battle.

What really matters, though, is not who wins the debate, but how we prepare for the inevitable. We’ve got to wean ourselves off our high-energy lifestyle.

We'd be foolish to wait for events to settle the debate once and for all. Let's say goodbye to oil. It's saying goodbye to us.

WE NEED YOUR HELP SHARING THIS VIDEO

  • Email the video to everyone you think needs to watch it
  • Share it through your social networks
  • Send it to your elected officials

Wednesday, August 22, 2012

Mind the Gap: The Difference Between Brent and WTI

There is much talk in the media about “oil prices” especially when it begins to hurt consumers at the fuel pump. Prices are sometimes referred to as  Brent crude or West Texas Intermediate (WTI) or sometimes just as oil. So what does this all mean and what are the differences?

Brent crude is sweet light oil sourced from fifteen fields in the North Sea. “Sweet” refers to the sulphur content. The lower the sulphur content the easier it is to refine. “Light” refers to the ability of the oil to flow freely which makes it easier to transport and refine. In comparison oil from the Alberta tar sands is considered to be heavy as it is transported as diluted bitumen (dilbit) and is much more difficult to refine.  WTI is lighter and sweeter than Brent with a sulphur content of 0.24% compared to 0.37%. WTI is sourced from around North America and priced from the trading hub of Cushing, Oklahoma.

Untitled-1

Figure 1: Monthly ratio of the nominal price of Crude Oil (petroleum); Dated Brent divided by the price of West Texas Intermediate. From Indexmundi.

Historically Brent prices lagged behind WTI until Brent began selling for more than WTI in the early 2000s for the first time. Since then Brent has gradually pulled away from WTI and was trading at a US$17.81 premium at the time of writing.

Goldman Sachs expects WTI to close the gap with Brent in the near future as shipments into Cushing slow, decreasing supply. This does not bode well for global oil prices with Goldman Sachs also predicting that Brent will reach US$120 in the next three months due to field maintenance in the North Sea and European market optimism.

Traditionally WTI has been used as the international benchmark for oil prices but over the last few years Brent has overtaken WTI in importance. This is backed by a 2007 report from the now defunct Lehman Brothers that WTI was no longer a gauge for the international oil market. As Cushing is landlocked it is restricted by pipeline capacity which has led to an supply glut over the past few years. WTI is not traded in any significant quantity outside North America.

Steve Austin at OilPrice.com: “Brent is the real international benchmark.Two-thirds of the oil consumed in the US is Brent, and two-thirds of international crude is priced to it. Still the media and market persist in quoting WTI, rather. This is a US singularity, like the non-adoption of the metric system.”

Figure 2: Oil production from the North Sea, based on EIA data. From Our Finite World.

North Sea oil production peaked in 1999. Even with record high oil prices since 2007 production has not been turned around. Oil companies have been in dispute with the British government over tax rates since 2011, responding by cutting production by 18% which lead to a £2.3bn drop in tax revenues. Since a government u-turn on the tax arrangement, investment in the North Sea is expected to increase from £8.5bn last year to £11.5bn this year.

This decreased output from the North Sea has raised grumblings that Brent is no longer a true indicator of global supply and demand either. But there is currently no viable alternative and so it looks as though Brent is set to stay as the global benchmark for sometime to come.

Saturday, August 18, 2012

Running on Empty: Big Airlines in Big Trouble

I have a joke with a friend of mine that airline pilots are nothing but glorified bus drivers. As cynical as this may be, for the majority of us with regular jobs who fly economy air travel is increasingly becoming like its land-based cousin: cramped, overcrowded and at times downright unpleasant.

Most people living in our modern industrial society take air travel for granted. We think very little about hopping on a plane and travelling around the world for little more than a couple of weeks wages. As jet fuel prices bounce along with the price of crude however many airlines are increasingly struggling to break even. Fuel prices now account for 35 percent of operating costs compared to 15 percent a decade ago. Air travel has always been a fickle business, earning an average net profit of one to two percent, compared with an average of over five percent for U.S. industry as a whole. Research from the 1980s found that some carriers would have zero profitability if they had lost just one out of ten business passengers. 

So how does the future look for the airline industry? If recent trends are anything to go by, not good. Not good at all.

Plane Trends

Airlines have increasingly been moving towards smaller aircraft despite the popularity of the “Superjumbo” Airbus A380 since its release in 2007. Airbus has sold 253 A380s while Boeing has orders for 106 747-8s with the large majority of these being used for cargo operations. Richard Aboulafia from Teal Group,  an Aerospace and Defense Market Analysis company believes that smaller, sleeker aircraft are the future of international air travel ““The market for large aircraft in general is disappearing fast. Most of the 747-8 planes are cargo. There’s just a limited market.”

Packed Like Sardines

In an effort to increase profits from each flight a number of airline companies are trying to fit more passengers onto each plane. The sale of an extra one or two seats can mean the difference between breaking even and a loss. While standing room only flights appear to be nothing other than a cheap marketing ploy companies have reduced the seat width in order to fit an extra seat in each row.

Air New Zealand recently replaced its older 747s with a significantly narrower 777-300ER. To accommodate the same 3-4-3 seat configuration the new seats are one inch narrower and the aisle has decreased in size as well. Air New Zealand was named the most innovative airline in the world last year Airlinetrends.com and so it is likely that other airline companies will follow suit.

In 2010 an Italian company, Avio Interiors,  introduced the world to its “Skyrider” saddle-style seat. Intended for up to four hour long flights the passenger sits at an angle with 23 inches of legroom (compared with 30 inches on a standard configuration) allowing more passengers per flight. Two years later no airlines have yet committed to the Skyrider seating but as fuel prices continue to rise one has to wonder how long it will take before it is seriously considered.  

At the other end of the spectrum some airlines have introduced what has colloquially been termed “chub class.” In an effort to accommodate the expanding waistline of Western flyers  Airbus is increasing the size of aisle seats to 20 inches wide on its A320 jets while decreasing middle and window seats by one inch. The premium wide seat will be sold at for an extra US$10.

Weight Reduction

Scoot Airlines, based out of Singapore has recently removed television monitors from airplane seats replacing them with Apple iPads. The television monitors and associated electronics are reported to weigh two metric tonnes.  According to Bloomberg this has enabled the airline to add 40 percent more seating while decreasing the weight of a fully loaded flight by seven percent. 

Extra Charges Everywhere

Traditionally the most successful airlines traded on glamour and providing a service experience. Recent trends however show that airlines are increasingly moving towards a no-frills approach in an effort to cut expenses. To do this airlines are  imposing costs on everything possible under the thin veil of “increased consumer choice.” Changes seen over the last few years include the removal of a complimentary item of check-in luggage, the removal of complimentary meals and extra charges for window seats and seats towards the front of the plane. The iPads on Scoot flights mentioned above will cost US$17 to hire for the flight.

Recommendations from a 2005 study suggest that a low-cost strategy should no longer be considered an exception but should rather become the norm for the airline industry. We can see this recommendation playing out today with the stripping of services from flights shifting to an almost purely user pays model.

Case Study: The Air New Zealand Situation

A good example of this new user pays model is Air New Zealand. In 2010 they changed to single class short haul flights with radically rebundled fares. Travellers can now choose from one of four options beginning with a seat, one 7kg carry-on bag, tea, coffee and water and access to some entertainment options but no new release entertainment. At the other end they have the ‘Works Deluxe’ which allows two priority bags, a carry-on bag, meal and drinks, a seat request, a guaranteed empty seat next to the passenger, premium check in, lounge access and better entertainment options.

Being the most innovative airline company does not necessarily make you the most profitable. Air New Zealand announced a 71 percent earning slump in February 2012. As part of its recovery plan the company announced it was cutting 441 jobs. The airline blamed a decrease in passenger numbers as well as as fuel costs NZ$173 million more than forecast. This is despite the airline enjoying “a solid performance from the domestic network including benefits from the Rugby World Cup and improved market share on the Tasman” according to Air New Zealand chairman, John Palmer.

The outgoing chief executive Rob Fyfe says the price of jet fuel has doubled over the last three years and due to the weak global economy it has been difficult to pass on the higher costs to passengers.The inflation adjusted average price of jet fuel was US$3.04 per gallon for the six months to December 31st. Going off jet fuel prices alone it is unlikely the airline will see much of a turn around in profitability for 2012. In the first six months of 2012  the average price barely moved, up US$0.04 to $US3.08.

The full year earnings are not released until the end of August but the few media releases coming out of Air New Zealand the last few months are beginning to sound increasingly desperate. On 19th July 2012 Fyfe and Palmer called for an “urgent review” of New Zealand tourism. Palmer told Parliament's finance and expenditure committee that despite operational improvements (newspeak for job cuts), Air New Zealand's financial performance was not healthy and decreased expenditure was yet to be reflected in its currently "disappointing" share price.

Air New Zealand is looking to focus on its domestic, Australian and Pacific service as these have been the most economically sustainable. According to Fyfe, "An aircraft flying to London and back, a 777-300, it costs $1.25 million to get that aircraft to London and back and over 50% of the cost of fuel, a 737 flying to Auckland - Wellington about 23% of the cost is fuel."

The Global Situation

Globally the situation does not look much better. Some Middle Eastern airlines and Asian carriers are still recording strong growth but they are the exception. The International Air Transport Association (IATA)  revised the Middle Eastern profit forecast in March 2012 from USD300 million to USD500 million assuming jet fuel prices stay stable.  A spike in oil prices could however could turn the forecast profit into a USD200 million loss for the region’s airlines. According to the IATA  average oil prices could reach as high as US$135 per barrel this year in the unlikely event of Iran closing the Strait of Hormuz. Oil prices this high would create a US$5.3billion loss for the global aviation industry.   

U.S. airline profits have historically followed a cyclical profit-loss pattern of three to five years since U.S. deregulation in 1978. Profit margins have always been thin, sitting at 1.6% during the 1980s and only 1.0% for the period between 1990 and 2000. The early 2000s however saw economic downturn accompanied by huge industry-wide losses of $7 billion in 2001, $7.5 billion in 2002, and $5.3 billion in 2003. The impact of 9/11 and the associated changes to the way airlines run as well as the Dot-com crash cannot be denied either. Between 2000 and 2005 the industry plunged into record operating losses of $40 billion in total.

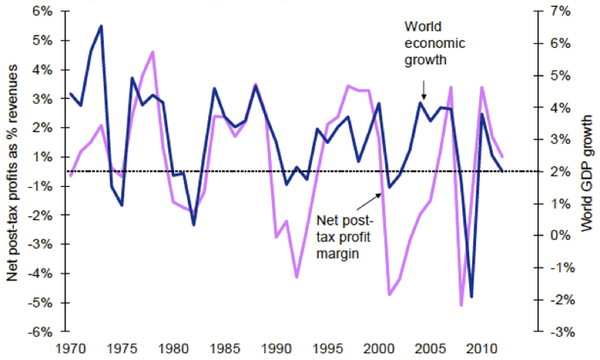
Figure 1: World economic growth and airline profit margins: 1970 to 2011. Source: IATA Financial Monitor for Jan/Feb-2012 released on 01-Mar-2012, sourcing IATA, ICAO & Haver.

Figure 1 clearly illustrates the cyclical nature of the airline industry. Whenever world GDP growth drops below two percent this is reflected by the net post-tax profit margin turning negative.

The director general and CEO of IATA, Tony Tyler, has cautioned that global GDP is not expected to pass two percent in 2012. “The risk of a worsening Eurozone crisis has been replaced by an equally toxic risk – rising oil prices. Already the damage is being felt with a downgrade in industry profits to $3.0 billion… With GDP growth projections now at 2.0%...it will not take much of a shock to push the industry into the red for 2012,” Mr Tyler said.  

Rising fuel costs have taken a massive chunk out of the airline industries profit margins. The cost of jet fuel closely maps that of crude oil prices. This means that when prices are high at the local pump the airline companies are also hurting.

The IATA has forecast the airline 2012 fuel bill is expected to be $US213 billion, equivalent to 34 percent of total operating costs. The IATA fuel price average for 2012 is currently $US128.6 per barrel which is estimated to add an extra $US31billion onto the forecast 2012 jet fuel bill.

These IATA forecasts illustrate the fragility of the airline industry. Profitability is an elusive prospect for the industry with the IATA commenting  that  “the best collective margin of the last decade of 2.9% (2007 and 2010) does not cover the cost of capital”. Cargo traffic around the globe declined 1.9 percent in May 2012 compared to May last year. Cargo traffic generated US$66 billion in 2010 but has declined every month since May 2011. “Business and consumer confidence are falling,” Tyler said. “And we are seeing the first signs of that in slowing demand and softer load factors. This does not bode well for industry profitability.”

Dirty Air

If airlines are struggling this much with the current economic conditions it is almost certain that a globally unified approach to carbon taxing would cripple the industry. A report from 2008 found that airlines were emitting 20 percent more carbon dioxide than previously estimated. This could grow to 1.5 billion tons a year by 2025, far more that the worst cast IPCC predictions. As a comparison the entire European Union currently emits 3.1 billion tons of CO2 annually. This emission prediction does assume that oil prices will stay relatively low and that economic growth gets back on track, two assumptions that are looking increasingly unlikely.

Travel While You Can

Environmental concerns aside if you want to travel anywhere in the next five years now is the time to do it. The global economy is extremely fragile at the moment. Petroleum deliveries are at their lowest point since September 2008, with the weakest July demand since 2005 and yet Brent crude prices are still sitting above $US116 per barrel. This is not to mention the impending US “fiscal cliff” where $600bn in tax increases and spending cuts come into effect on January 1, 2013. Unless the US Congress  comes to some kind of agreement on raising the debt ceiling again by the end of this year GDP growth could be reduced by four percent, plunging the US into recession. Europe is cannot escape its current quaqmire without huge upheaval and there is now talk that France will be the next to crumble leaving Germany on its own. China’s growth has slowed to a three year low of 7.6 per cent with little sign of recovery in the next few months.  

This is all bad news for airlines that are already combatting high fuel prices. I expect to see a number of big name airlines fold or amalgamate in the next two years as financiers can no longer afford to prop up an industry that is hemorrhaging with no relief in sight. This could mean a reduced number of flights, less options of places to travel and skyrocketing ticket prices. While mother nature might thank us for the reduction in emissions the airline industry is running on empty. 

Monday, August 13, 2012

Update - The New Paradigm: Volatile Oil Markets

It was kindly pointed out to me last week by erich, a commenter on my article at Energy Bulletin that the data set I had used had not been adjusted for inflation. I had originally argued that it shouldn’t make much difference. I thought that as I was dealing with the price changes within a year and as the ANOVA treats each year as a separate group the effect of inflation would be negligible. However after thinking about it for a while I decided it would be worthwhile to run the inflation adjusted numbers to remove any doubt on the conclusions I had drawn from the original data set. Using this consumer price index (CPI) information I adjusted my original data set to 2010 dollars and reran the ANOVA.

Figure 1: Statistically significant Bonferroni-Holm test results looking at the difference between years in the monthly change in price for crude oil (US dollars per barrel), simple average of three spot prices; Dated Brent, West Texas Intermediate, and the Dubai Fateh, August 1982-June 2012. Data from http://www.indexmundi.com/commodities/?commodity=crude-oil

Figure 1 shows there were less results rejecting the null hypothesis, 32 compared to 59 in the unadjusted data which goes to prove erich’s point that at least some of the effect I was seeing was due to inflation. I feel somewhat vindicated at the same time that my original conclusions still stand. As erich said in his comments after I shared the new results “Adjusting prices for inflation makes your analysis and conclusions more robust and defensible” and so I thank erich for first raising the issue in a polite and encouraging manner.

I also tracked down some more oil price data sets that I hadn’t come across before and I was excited to see if my hypothesis, that oil volatility has significantly increased since conventional oil production plateaued in 2005, could be replicated.

This morning I came across an article on the 2012 United States Presidential “Energy Election” at a blog called Con Carlitos, written by Calvin Sloan. He had an interesting footnote which explained something I had not quite grasped and I will quote here in full:

As noted by Steve Austin at OilPrice.com: “Brent is the real international benchmark.Two-thirds of the oil consumed in the US is Brent, and two-thirds of international crude is priced to it. (Brent crude is sourced from fifteen oil fields in the North Sea.) Still the media and market persist in quoting WTI, rather. This is a US singularity, like the non-adoption of the metric system.”

Due to this I decided to look specifically at Brent crude prices as the strongest conclusions can be made from that data. I looked at both monthly and weekly Brent Crude prices between May 1987 and June 2012. Using average annual CPI data from the U.S. Bureau of Labor Statistics I adjusted the monthly and weekly Brent crude prices to 2012 dollars .

The monthly data returned only four results rejecting the null hypothesis. 2008 was significantly different to 1993, 1994 and 1995 and 2011 was significantly different to 1995. I was surprised this result was so low and intrigued to see if the weekly data was any different.

Brent May 1987 June 2012 volatility

Figure 2: Statistically significant Bonferroni-Holm test results for weekly Brent crude prices May 1987 to June 2012.

It would appear from Figure 2 that the monthly effect was largely masking the difference in Brent price volatility between years. When looked at on a weekly level we see that 76% of the statistically significant results occur after the 2005 production plateau.

It can be concluded  that while oil prices may be highly volatile on a week to week basis the effect is reduced on a monthly basis. We can also conclude that post 2005 we have seen a marked increase in weekly oil price volatility. The first six months of 2012 data is the fourth (equal with 2010) most volatile year for oil prices in the last twenty-five years behind only 2011, 2009 and 2008. The data from July and August  2012 was not included in this data set but it is my guess they would push 2012 further up the ranks. It is even possible by the end of the year that 2012 could be the second most volatile year after 2008. I for one will be watching oil prices over the next few months with great interest to see if the great yo-yoing continues.

Wednesday, August 8, 2012

The New Paradigm: Volatile Oil Markets

One of the many hypotheses put forward by peak oil theorists is that as the production of conventional oil peaks we will see increasing volatility in oil markets. The basic reason for this is that oil is the fundamental energy resource on which our modern industrial society runs. Economies begin to falter under the pressure of high oil prices as they can no longer sustain growth and so demand for oil falls. As demand falls, so does the price of oil which eventually reaches a level that is conducive to economic growth. Demand increases again followed by the price of oil and the cycle repeats ad infinitum. That is of course until you throw a proverbial spanner in the works in the form of restrictions on the supply side. Historically the most influential spanner has been unrest in the Middle East. However we are increasingly seeing the impact of another much larger and altogether much more catastrophic spanner: the peak production of conventional oil.

Just look at how much more volatile prices have become over the last 30 years:

image

Figure 1: Monthly change in price for crude oil (US dollars per barrel), simple average of three spot prices; Dated Brent, West Texas Intermediate, and the Dubai Fateh, August 1982-June 2012. Data from http://www.indexmundi.com/commodities/?commodity=crude-oil

image

Figure 2: Standard deviation of the monthly price change for crude oil (US dollars per barrel), simple average of three spot prices; Dated Brent, West Texas Intermediate, and the Dubai Fateh, August 1982-June 2012. The standard deviation provides a numerical measure of the overall amount of variation from the mean in a data set.

Figure 1 and 2 clearly show that something has been happening to oil prices since perhaps the early 2000s. Visually large changes before that can be attributed to the oil price bubble bursting in 1985 due in part to a massive increase in rig counts, the 1990 Iraq War and the Dot-com bubble beginning in 2000. Some of this variation post 2000 can be attributed to the American invasion of Afghanistan and Iraq (2001 and 2003 respectively), the global financial crisis of 2008, the Arab Spring beginning in December 2010 and the current Syrian crisis. But this doesn’t explain the whole story either. We are in a new era where oil prices are unprecedentedly being affected by production constraints. Figure 2 shows that since 2005 the data values are more spread out from the mean, exhibiting more variation than any other time over the last thirty years except for the 1990 Iraq War. Coincidentally 2005 is also the year when global conventional oil production tailed off: rising only 0.5 per cent between 2005 and 2011.

Up until this point it has been a somewhat subjective analysis. No hard statistics have been carried out. I wanted to see just how different the volatility in prices post 2000 were compared to the rest of the data set. For those of you not interested in the mathematic side of things you can skip this part and go right to the results. But in the spirit of academic openness I would like to explain my methodology. 

Methodology (The Sciencey Stuff)

The data used to create Figure 1 was split into annual groups 1983,1984 etc and converted into their absolute value so that all numbers were positive. Because the monthly oil price change between years was being compared it didn’t matter if the change was positive or negative, just that it changed. A one way ANOVA test was used to determine if there were significant differences between groups of data (i.e. each year). Due to carrying out an ANOVA test  the ratio of the smallest to largest standard deviation could be no more than two (clearly not true from Figure 2), so the figures were transformed to log10. This also ensured that the data followed a normal distribution. The data point from May 2007 was removed as that figure was 0 (i.e no change in oil price from the month before) and could not be calculated to log10.

Using Daniel’s XL Toolbox plugin for Microsoft Excel the ANOVA test was calculated along with a post-hoc Bonferroni-Holm test. Post-hoc tests are carried out in order to find patterns or relationships between subgroups of a data set and the Bonferroni-Holm test is generally known as the most conservative of all post-hoc tests. In this case the relationship being determined was whether or not the change in oil price within one year was significantly different than any other year.

The null hypothesis is that there is no significant difference in monthly oil price change between years. The alternative hypothesis is that there is a significant difference in monthly oil price change between at least two years. 

Results (The Interesting Stuff)

Just a couple of scientific results before we get to what we are really after. The F-value for the above ANOVA is 6.991 and the p-value is 3.02E-21. Because the p-value is less than 0.05 we can reject the null hypothesis and be certain that there is a significant difference in monthly oil price change between at least two years, possibly more. But which years exactly? This is where the Bonferroni-Holm test comes in.

Bonferroni-Holm test

Figure 3: Statistically significant Bonferroni-Holm test results.

Figure 3 shows the how the only statistically significant differences in monthly oil price changes between years occurred after 2005. In other words between August 1982 and  December 2004 prices rose and fell relatively benignly compared to what happened after 2005. We can see intuitively in Figure 1 what we are told statistically in Figure 3. The mid to late 80s and 90s saw little volatility in oil prices bar the 1990 Iraq War and stayed relatively calm right up until the 2003 Invasion of Iraq. Oil prices haven’t stopped see-sawing since with the first statistically significant difference seen in 2005.

This is only one data point however and we don’t see any grouping of statistically significant volatility until 2007 when the global economy began getting the jitters with concerns surrounding the US housing bubble. The next two years were havoc on the oil markets as prices bounced up and down trying to find some sort of equilibrium. 2010 and 2011 saw a period of calm as the the economy finally readjusted. All was not well though as oil prices this year have so far been the fourth most volatile in the last thirty years.

Conclusion

With the production of oil from conventional sources almost stalling since 2005, concerns about the collapse of the Euro zone still very real and the unknown outcome of the Syrian civil war we are living once again in very uncertain times. This is reflected in the volatility of oil prices so far in 2012. At the time of writing West Texas Intermediate crude was at US$93.25 and Brent crude was at US$112.00. So far this year WTI has fluctuated between $80 and $110 per barrel and Brent between $90 and $123 per barrel. Price fluctuations like this are a double whammy of bad omens. They are neither a sign of healthy economy nor conducive to growing an economy.  

I am not the first person to point this out. Shiu-Sheng Chen and Kai-Wei Hsu from the National Taiwan University published a paper this year in the journal Energy Economics that showed how trade between countries decreases when there is high oil price volatility. Gregor MacDonald over at Chris Martenson’s Peak Prosperity has an article on how oil price volatility kills economic recovery. John Timmer at Arstechnica discusses the implications of the paper by the University of Washington's James Murray and Oxford's David King in Nature, published earlier this year. Murray and King argue that once demand consistently exceeds oil supply the economy enters what they have coined  a "phase transition." They believe we'll be in the volatile phase from here on out.

Chris Nelder at Smart Planet wrote in June that spare capacity will “drop to critically low levels in late 2014/early 2015 as depletion finally overwhelms our efforts to fill the gap with unconventional oil, kicking off a long era of harsh volatility in both oil prices and the global economy as a whole.” “So enjoy the relative stability of the next two years, and take advantage of the narrow ledge concept to trade oil profitably as it bounces between the price floor and ceiling.” Looking at the results I’ve calculated above I don’t think we are looking at a period of relative stability for the next two years. This means the economic situation could be even worse if Nelder’s predictions come true in late 2014/early 2015. We are seeing high oil price volatility right now.      

John Michael Greer of the Archdruid Report published a paper in 2005 titled How Civilizations Fall: A Theory of Catabolic Collapse. His main thesis is that “as societies expand and start to depend on complex infrastructure to support the daily activities of their inhabitants” it becomes increasingly energy intensive to maintain this infrastructure. Eventually “the maintenance needs of the infrastructure and the rest of the society’s stuff gradually build up until they reach a level that can’t be covered by the resources on hand.” What follows next is catabolic collapse, where the society reverts to a level that can be sufficiently maintained, at least for a while. After a time the society becomes anabolic, or begins to build up again until it reaches some new limit and then collapses again. Greer argues this is what Chinese and other societies have done dozens of times throughout history. He believes our current oil based society is in the clutches of catabolic collapse at the moment (it should be noted that collapse refers to a breakdown over a period of years, not some kind of biblical apocalypse).

Whether or not you subscribe to the idea of peak oil it is undeniable that oil markets have been more volatile over the last five to seven years than at any other period. We have entered a new paradigm where oil prices are marked by extreme fluctuations. This volatility is damaging to economic recovery in a time when many countries are already limping along propped up on huge amounts of foreign debt and little to no economic leadership. Oil price volatility is the new norm and there is nothing anyone can do about it bar an unlikely societal shift to a low energy society. The best response is at the personal and local level by reducing your reliance on fossil fuels right now in every aspect of your life. At the very least when things deteriorate over the next few years you will have an extra layer of resilience.

Monday, June 25, 2012

Myth Busting The Polyannas 1: Roger Harrabin

From Dictionary.com:

Pol·ly·an·na

noun

1. an excessively or blindly optimistic person.

adjective

2. (often lowercase) Also, Pol·ly·an·na·ish. unreasonably or illogically optimistic: some pollyanna notions about world peace.

This is the first in a series of posts that address the phenomenon seen over the past few years of the proliferation of articles arguing that peak oil is dead and that we are in a new era of liquid fuel abundance. I have already addressed this issue in general with my previous post Seven Myths Deniers Use To 'Debunk' Peak Oil, Debunked. But with more articles coming out like this weekly I have decided to take on the authors of these overly optimistic puff pieces and explain paragraph by paragraph exactly why these people are so wrong.

First up in this series is Roger Harrabin. Harrabin is certainly no slouch  broadcasting on environmental and energy issues since the 1980s and winning a number of broadcasting awards. He currently works as the BBC’s environmental analyst and is one of their senior journalists on environmental and energy issues. So it came as a surprise when I came across Harrabin’s article this week entitled Shortages: Is ‘peak oil’ idea dead?. He managed to invoke a number of straw man arguments and bizzare claims and concludes that the end of the Oil Age is so far off that it’s not worth worrying about. Let’s take a look at the specifics below.

Harrabin: “Bouts of anxiety are periodic. In the seventies a Shell geoscientist, M King Hubbert, sounded an alarm that supplies would peak by 1995 "if current trends continue."

They didn't peak. Fear is a powerful motivator and forecasting a shortage can be a good way of avoiding one.

Instead of seeing the 1970s oil crisis end in a long-term shortage, we responded by developing more fuel-efficient cars and burning less oil for heating. And what's more, oil production continued to grow.”

The qualifier above is “if current trends continue”. What Harrabin fails to mention is what Hubbert says in the Youtube video from 1976 that he links to.

Hubbert: “OPEC countries are tampering with this curve right now, they’re actually curtailing production somewhat and so it’s conceivable that this peak up here might be shifted over to the back side a little bit. We might cut off this rate of growth and stabilise. If we did that would extend this middle 80% by some 19 years maybe. But is doesn’t alter the basic thing that I’m saying significantly.”

We can see from this statement that Hubbert was intently aware that his model was simply that: a model. Market adjustments by OPEC or some other unknown could potentially move the peak into the future by 20 years at the most (2015 based on Hubbert’s original 1995 calculation). However Hubbert’s underlying theory would still ring true even if the peak was extended. What Hubbert didn’t specifically predict was the 1979 Iranian Revolution that caused oil prices to skyrocket, destroying demand and reducing global oil consumption by 7 percent between 1980 and 1983. High oil prices during this time also saw a shift to natural gas and electricity for home heating and increasingly fuel efficient cars that also impacted on global oil consumption. 

While oil production didn’t peak in 1995 as Hubbert originally predicted, Gail Tverberg recently showed in a brilliant post using EIA data that world crude oil production from conventional sources peaked  in 2005. Since then crude oil production has risen only 0.5 percent. Total oil supplies grew only 3.0 percent between 2005 and 2010, far lower than the 10.2 percent growth estimated from similar periods before 2005. This is a far cry from reaching a new era of energy production with oil from unconventional sources taking up the slack left by conventional sources.

Chart from: http://ourfiniteworld.com/2012/04/09/what-the-new-2011-eia-oil-supply-data-shows/

Moving on:

Harrabin: “But the reflexive response we saw in the 70s has repeated itself. Thanks to government rules and fear of rising oil prices, new cars are using much less fuel.”

This is true up to a point. New engine technology uses fuel much more efficiently than old cars. But does this make any difference to the fleet as a whole? Not according to the Australian Public Transport Users Association (PTUA). It has been documented that as fuel efficiency increases that engine size tends to increase shortly after due to consumer demand:

“....Hybrid technology, it seems, is being used in much the same way as earlier under-the-hood innovations that increased gasoline efficiency: to satisfy the American appetite for acceleration and bulk....Consumer Reports, in an article published in May, found that in actual on-the-road conditions the Accord hybrid averaged 25 (miles per gallon), versus 24 mpg for the 4-cylinder model and 23 mpg for the nonhybrid V-6....If every car in the country were converted to a hybrid with that improved mileage, the gain would be swallowed up in three to four years by growth in driving demand.”
-“Hybrid Cars Burning Gas in the Drive for Power”, New York Times, 17 July 2005

“At the launch of the new-generation Toyota Prius in Sydney yesterday, chief engineer Akihiko Otsuka admitted the company had opted for a bigger, more powerful engine because customers had demanded it...."With a different approach, we could have done even better. However, customers told us they wanted more performance. In response, we selected a larger engine.””
-“Prius a paler shade of green”, The Age, 7 July 2009

Data from the Australian Bureau of Statistics shows that between 1995 and 2007 fuel economy of the average passenger vehicle has remained relatively unchanged.

Transport researcher Patrick Moriarty has argued that improvements in engine efficiency over the past few decades have been offset by trends towards larger vehicles such as SUVs, increased use of air conditioning, electronic components demanding greater weight and power input, aging of the car fleet and comprises required to reduce air pollution. 

The PTUA also reports that according to Tom McCarthy in his book Auto Mania,  while the 1970 oil shocks resulted in short term fuel efficiency gains, once oil prices stabilised in the 1980s drivers reacted with such fervor that any long term benefits were wiped out. Fuel economy became associated with sacrifice and poverty, two notions which had no place in the new age of materialistic pursuit.

Harrabin: “And what do you know? In 2008 we reached a new production high of 73.71 million barrels a day according to the IEA, thanks largely to new technologies for getting the stuff out of the ground.

Oil comes from fragments of vegetable matter laid down amongst particles of rock. Even by 1980 we could only recover about 22% of the oil from a typical well. Technology has now driven that figure to 35%. Same oil wells, more oil.

Supply has been boosted by unconventional oil extracted from rocks which were previously uneconomic to exploit - like oil shales and tar sands. It takes much more energy and water to separate the oil from these rocks than conventional oil drilling so it's much worse for the environment.”

This is all true. But how much difference does this new technology and oil from unconventional sources really make? As we can see from Gail Tverberg’s chart above, not much. Sure it keeps the overall growth in global oil production on an upward trend but it comes at a huge cost not only environmentally but also economically. Chris Nelder has done a great job outlining the new base cost of oil. Nelder quotes veteran petroleum economist Chris Skrebowski’s research that in order for oil companies to turn a profit and invest in future infrastructure oil prices must be at least between $80 to $110 per barrel. This is incredibly bad news for the global economy which runs on cheap energy. When the price of that energy rises too high the economy gets speed wobbles and crashes as Jeff Rubin has shown convincingly. It is especially worrying given Skrebowski’s data showing figures from Barclays Capital that operators’ budget assumptions have risen to $87 per barrel of oil, literally the maximum carrying capacity of the US (and probably European) economies.     

Graph from: http://www.odac-info.org/newsletter/2011/09/16

Harrabin: “Fears over "peak oil" haven't evaporated, but the advent of unconventional oils has driven the peak further into the distance.”

Harrabin doesn’t state just how far into the distance the peak has been driven but given his nonchalance I assume that that he thinks peak oil won’t be a problem in his lifetime. Personally I tend to side with Robert Hirsch who anticipates world oil production (all sources) will go into decline in one to four years. Hirsch also makes the point that there is $50 to $100 trillion worth of equipment on the planet that runs on liquid fuels and electrification of this infrastructure will take a long time to come online. 

Harrabin: “There's also a boom in unconventional gas production that's made the Americans relax about energy security. Gas can be turned into diesel - at a cost - pushing peak oil further into the distance. If things get really bad we can also turn coal into diesel.”

This is where Harrabin completely loses touch with reality. Natural gas in itself is four times less energy dense than oil. In practical terms that means a fuel tank four times larger than is currently used. Say goodbye to your back seats of your car. Robert Rapier has shown that replacing all U.S. gasoline consumption with natural gas would require a total usage of 39.4 trillion scf per year, an increase in natural gas consumption of 71% over present usage, hardly a likely scenario.

To be fair Harrabin is talking here about gas to liquids (GTL) conversion which doesn’t require any changes on the combustion engine side of things but is still highly dubious if it is economically sustainable. The first large scale gas to liquids plant built in Qatar by Shell ballooned to $18 billion, almost four times the original estimate.  That is over 70% of Shell’s intended capital expenditure from 2011. Last year Shell projected the plant would generate $6 billion a year in profit assuming oil prices at $70 a barrel. Shell is hoping it has learnt from its mistakes in Qatar and is considering building another similar sized plant in Louisiana at a cost of $10 billion with Shell.

Capital costs for GTL plants range from $25,000 to $45,000 per barrel of daily capacity, depending on production scale and site selection. By comparison, the cost of a conventional petroleum refinery is around $15,000 per barrel per day. GTL is profitable when crude oil prices exceed $25 per barrel and natural gas prices are in the range of $0.50 to $1.00 per million Btu. The economics of GTL are extremely sensitive to the cost of natural gas feedstocks. At the time of writing U.S. spot prices for natural gas were sitting around the $2.50 per million Btu mark which is historically extremely cheap and below operating cost and Brent was sitting around $91 a barrel.  According to Platts as recently as this time last year it was still more profitable to turn natural gas into LNG rather than GTL.

As for coal to liquids (CTL) it has currently only been carried out on a laboratory scale and no large scale CTL plants exist. The IEA estimates that the capital investment will be absolutely massive, between $70 and $80,000 per barrel of daily capacity or 2-3 times more expensive than a GTL plant. 

Harrabin: “The Stone Age didn't end because we ran out of stones…”

Harrabin is of course exactly right here. The Stone Age ended because human beings discovered how to smelt first copper and then bronze which could be fashioned into more efficient tools and weapons. Likewise in energy circles wood was the most important fuel up until the 1880s when it gave way to coal and then natural gas and oil. For a brief period a number of commentators believed nuclear was the next logical step in the energy progression. But for a number of reasons: safety, transportability, inhibitive cost etc nuclear never made the impact that was once promised of it. So we stuck with oil, the single most energy dense and transportable substance ever discovered on our planet.

For Harrabin to compare the Stone Age to the Age of Oil however is to catastrophically misunderstand the issue. There is no alternative to oil that can be as easily extracted, transported, stored and used as oil.  There is no alternative to oil that will let us continue our lifestyles unaffected. To misunderstand this critical point is to misunderstand the predicament that peak oil puts humanity in entirely.

We are not going to run out of oil cold turkey. Instead we are facing a long descent that will see times of relative prosperity followed by depressions and recessions as the world economy adjusts to its new low energy diet.  Articles such as Harrabin’s do a great disservice to humanity by advocating a business as usual approach to the peak oil predicament. Change is coming and the sooner we ready ourselves for it the smoother the descent will be.

Thursday, June 7, 2012

Brace Yourself For The Next Global Recession: It’s Already Begun

The global economy is based on transportation networks that are propped up by cheap energy. Because of this we can be relatively certain that when demand for energy begins to fall that the economy is slowing. And when energy prices fall sharply we can be relatively certain that the economy is not just slowing but entering into a recession.

Jeff Rubin, the former Chief Economist for CIBC World Markets has showed convincingly how global recessions are linked to high oil prices. Rubin had this to say back in May 2011:

There will be many dress rehearsals in commodity markets before the next global recession. An example is last week’s dramatic and broad-based selloff that took oil prices for over a $10/barrel tumble. And there is no doubt that despite the scarcity of the resource, the price of oil will crash the next time the global economy sewers.

What we are seeing right now is the price of oil crashing. Brent crude futures for July delivery dipped below US$100 per barrel. Prices are on track for the biggest monthly loss since 2010. Brent crude prices have plummeted by over 25 percent from a high of US$126.40 in March 2012.

First quarter GDP growth forecasts for the U.S. dropped almost 16 percent from 2.2 percent to 1.9 percent. The Standard and Poor’s 500 index was poised for its worst monthly drop since last September. Bill Clinton believes the U.S. is already in a recession.

India’s GDP growth has slumped to a nine year low of 5.3 percent. China is slowing down too with the World Bank dropping growth forecasts by 2.4 percent from 8.4 percent to 8.2 percent.

The situation in Europe is even worse with Greece highly likely to default on loan repayments and leave the monetary union before the end of the year. If Greece goes it is quite possible that Portugal, Italy and Spain will not be far behind. This will wreck havoc on those countries left in the union as the Euro begins to rise again. This will squeeze exports, especially in Germany which has remained relatively unscathed by the Euro problems so far. The United Kingdom is officially in recession and the Bank of England has cut interest rates to a 300 year low.    

In economic terms the sky is falling. We are likely to see the price of oil continue to fall but probably not as low as in 2008. This is due in part to the huge increase in production from unconventional oil plays over this period. The baseline cost of oil today is more expensive than even five years ago.  The Canadian tar sands and many of the tight oil fracking operations become unprofitable under $40 per barrel and so we will likely see a number of oil and gas projects cancelled or deferred just like in 2008.

No matter how deeply tinted your rose glasses are the world economy does not look good right now and almost every indicator points to it getting much worse. Brace yourself.

Sunday, June 3, 2012

Electric cars will save us all (not)

James Henderson at The Standard has kindly given permission to syndicate this post - the original is found here.

You know how, whenever someone points out that spending $12 billion on highways that make no economic sense makes even less sense when you consider that people are driving less because of the price of petrol and will only reduce their driving more in the face of even higher petrol prices, some idiot says ‘we’ll just invent alternatives, drive electric!’. Yeah, it ain’t happening.

Leaving aside the problem that there’s not enough lithium producable for all the batteries we would need, there’s just no way that the take-up of electric cars is going to be sufficiently fast to make a big difference to the oil-intensity of driving in New Zealand.

There are 46 electric cars registered in New Zealand, out of 3.4 million. That’s up from 25 in 2007. At the current (let’s assume exponential) rate of increase, it will reach 350 by 2022.

By that time, petrol prices will be $5 a litre.

Even if every car registered from now on was electric (and that wouldn’t be possible even if New Zealand bought the world’s whole electric car production), over half the fleet in 2022 would be oil-driven because most cars that will be on the road in 2022 are already on the road. The average age of the car fleet is 13.59 years and that’s increased by 1.5 years in the past five years and 2 years in the past ten.

People aren’t responding to high oil prices by buying electric cars: they’re responding by keeping their old cars and driving them less (traffic volumes have been falling for nearly all of the past four years and vehicle kilometres travelled are down about 7% per capita from peak)

MoT projects that 85-90% of vehicles will still be conventional in 2030. Indeed, the likelihood of ongoing weak growth and high fuel prices leaves businesses and families with less capital for investment in new vehicles.

All of which makes the daydreams of people who say ‘yeah, we should spend $12 billion on uneconomic roads, because we’ll all drive on them in electric cars’ even more fanciful.

Saturday, May 26, 2012

Review: Jeff Rubin on The End of Growth, Capilano University, Vancouver, 24/05/2012

Last night I went to see Jeff Rubin speak on his new book, The End Of Growth. As the former Chief Economist for CIBC World Markets he brings an intimate knowledge of financial markets and how they work to the peak oil/end of growth community populated by other venerable thinkers such as Richard Heinberg, Chris Martenson and John Michael Greer.

Rubin is a formidable speaker and for someone like myself who has been interested in these issues for a number of years it was exciting to see the auditorium close to sold out. This is a message that needs to be heard and I thank Jeff Rubin for taking his views on the road and speaking to people about them. He is also self-deprecating and humble, often referring to how he left CIBC World Markets due at least in part to the global financial crisis and the vast effects that had on the world.

Rubin spoke  for roughly forty minutes followed by a forty minute question session. He covered many topics, mainly surrounding the global financial system, oil and gas, the Euro situation, the United States and of course Canada. I have collated his main points below under the relevant headings. Apologies to Jeff Rubin if any of the figures I recorded are incorrect.

The European Crisis 

  • My question to Jeff Rubin during question time was this: Why is austerity the go to strategy in the Eurozone? If you were in charge what policies would you put in place to get Greece etc out of the current quagmire? Rubin predicts that Greece will default on loan repayments within the next 4-5 months and believes this is the only option left. Spain, Portugal and Italy will probably not be far behind (Portugal, Italy, Greece and Spain are referred to as the PIGS). For the last 200 years Greece has been in default 50% of the time so it is not anything particularly new for them. Germany wants to keep the PIGS in the monetary union because it lowers the Euro enough to make German exports attractive to overseas buyers. If the PIGS are forced to leave the monetary union German exporters will have to be bailed out. The big question is if the PIGS leave the monetary union will they also be forced to leave the Euro free trade zone?
  • Due to the interconnectedness of the global financial systems any defaults in Europe will be felt by absolutely everyone. It is likely that your bank has interests connected to a bank in somewhere like France that has interests in either Portugal, Italy, Greece or Spain.

The Global Financial System

  • The global financial system (GFC) remains relatively unchanged since the 2008 global financial crisis apart from losing a few major players such as the Lehman Brothers and Bear Sterns. Rubin believes we are at the beginning of another financial crisis right now and that in the aftermath financial systems will finally be reformed as they should have been after 2008.
  • Huge deficits and stimulus bailouts are no substitute for cheap oil because they don’t lead to long term growth.

General Predictions

  • Youth will stay at home longer until their mid 20s and people will work until they are much older. The time of leisurely retirements is over.
  • The global trade system will be greatly reduced as oil becomes more expensive. We will see the relocalisation of industry with agriculture and manufacturing producing much closer to markets.
  • The tax base will no longer grow and so governments will have to plan on little to no economic growth when making policy decisions.
  • Government will increasingly contract out services to private companies who can provide services at a cheaper rate in an effort to decrease government spending.
  • Real estate prices in cities and downtown areas will rise and outer suburbs may revert back to agriculture as people can no longer afford to commute large distances to and from work.
  • Education will shift to more practical skills that involve making things ourselves. The FIRE services (Finance, Insurance and Real Estate) will still exist but in a greatly reduced role.
  • Tourism will become much more localised. Air travel will revert back to what it was like in the 1960s and 1970s where ticket prices were four times higher than today.

Energy/Consumption

  • Energy consumption is easily reducible: Denmark reduced carbon emissions by 13% to 1990 levels as part of Kyoto commitments, in contrast Canada saw a 30% increase in carbon emissions over the same period (much of this due to the Alberta tar sands) and then left the Kyoto agreement.
  • Denmark's saw this carbon reduction with 80% of its electricity coming from coal with the other 20% coming from wind. This was due to high electricity prices meaning when it gets cold they put on more clothes rather than turning up the air conditioning. There is also a 180% surcharge on buying a car so many people either walk, cycle or use public transport.
  • Before the Japanese earthquakes last year Japan produced 30% of its electricity from nuclear power. Today that figure is 0% after shutting down all of its 34 nuclear power plants due to safety concerns.
  • Oil is four times as energy dense as natural gas making it much more viable as a transport fuel. The reason the price differential between oil and natural gas is not arbitraged is because natural gas is a very poor substitute for oil as a transit fuel.
  • As for the long term viability of shale gas it is worth watching the future of Chesapeake Energy, the largest investor in shale gas, which is currently in huge financial trouble.

Canada

  • Canada has seen a transformation into a petro-state over the last decade.
  • Canada has very low population density and so faces a unique set of problems.
  • The financial and power fault lines will increasingly be between the haves and have nots in terms of oil producing land. Ontario will be a big loser and the power and financial base will increasingly shift to where the oil is in Alberta and Newfoundland.
  • Mark Carney, the governor of the Bank of Canada, advises the public not to get mortgages but then keeps interests rates low that make mortgages attractive. This is akin to surrounding an overweight person with unhealthy food and telling them not to eat anything.
  • British Columbia would be foolish to accept the TransCanada pipeline to ship Albertan oil to China. It would be absorbing the environmental costs of the pipeline with little economic benefit to the area. Any spill would be devastating to marine life in the area and the surrounding economy.

Population

  • Japan is an opportunity to be studied as it has had a declining population for the last decade. It can be treated as a microcosm for where the rest of the world is heading.
  • Because economic growth is directly linked to lower birth rates, in an age of zero growth it is essential to focus on female education to reduce birthrates.
  • Hungry people have three choices: rebel, migrate or die. With lower energy use per capita migration is becoming increasingly difficult. The Arab Spring was in Rubin’s view Malthus come true. A huge population with very few economic options rebelled and overthrew a number of governments.

Some Policy Solutions

  • Job share policies such as seen in Germany are better than government stimulus because it keeps unemployment low by keeping people in work, albeit at reduced hours. The benefit of this is increased leisure time and a steady tax base.
  • There should have been massive investment in public transport after the GFC instead of bailing out car companies. Massive investment in public transport is essential.
  • Bank regulation is essential. Especially decoupling banks from investment firms which have been a major cause of problems since deregulation in the 1980s. Privatised benefits and socialised losses of banks is unacceptable and must be stopped.
  • Free money policies need to go.

Silver Linings for Climate Change

  • Scandinavian countries have some of the lowest consumption levels in the West but the highest levels of happiness.
  • As the world economy slows carbon emissions will also be reduced. This means that the emissions projections from the IPCC will probably never eventuate which will hopefully alleviate the worst of climate change.
  • Coal prices are already over $100 a tonne. Most climate change projections include massively increasing coal use although this is unlikely given where the global economy is heading. Where will all this coal come from and who can afford to pay those kinds of prices?
  • In 2009 U.S. carbon emissions fell not due to any government policy but due to zero growth.
  • When the USSR fell carbon emissions fell by 30% due to the massive contraction of the economy.

Thursday, May 24, 2012

Drill, Baby, Drill! More Drilling Doesn't Necessarily Mean More Oil

The United States has a problem. An oil problem. No matter how many wells are drilled oil companies just can't seem to raise production to anywhere near the figures required to reach the holy grail of energy independence.

Looking at the oil production data, active rigs in use and footage drilled over the last forty years it is clear that no matter how much investment is made are there just isn't the size and quality of oil producing fields left in the U.S. any more.

image

Figure 1: U.S. Crude oil production (including lease condensate) and active rig count, January 1973 to January 2012.

Various news items and opinion pieces have announced that the United States is entering an exciting new era of energy independence. Figure 1 shows that the truth is a bit more sobering. We can see that over the last 40 years the overall trend for crude oil production has been steadily decreasing. There are a few anomalies however. In the late 70’s and early 80’s the rig count climbed dramatically as a response to high global oil prices. This however only produced a very slight increase in oil production over the boom period. Once the bubble burst in 1985 crude oil production continued on its downward trajectory. Rig counts fluctuated wildly until the Asian recession in 1998, recover and then dip again after the Dot-com crash of 2000-2001 and recover again until the beginning of the global financial crisis (GFC) in 2008. This is where things get interesting. As the economy begins to recover after the GFC and rig counts begin rising, U.S. oil production begins rising for the first time in over 20 years. This is due largely to rigs coming online that employed hydraulic fracturing or fracking, the process that enabled oil companies to extract oil from previously marginal areas. 

This increase in oil production is what pundits have been hailing as a new era for U.S. energy independence. There are a number of reasons why this is overly optimistic and these will be explored below.

image

Figure 2: U.S. crude oil production (including lease condensate) and U.S. footage drilled for crude oil, natural gas, and dry exploratory and developmental wells (thousand feet), January 1973 to February 2012.  

Figure 2 shows footage drilled had been steadily increasing from the early 2000s but fell off during the 2008 financial crisis. Once the global economy began to recover drilling increased sharply to the highest numbers seen since the mid 1980s. The remarkable thing is this: even though drilling is at a 25 year high production has not followed suit. Since July 2009 the drilled footage has increased a whopping 105.5 percent but production has failed to follow increasing by only 7.6 percent. Clearly all is not well in the land of oil and gas.

image

Figure 3: Ratio of U.S. crude oil production (thousands of barrels per day) to active rig count, January 1973 to January 2012.

Figure 3 shows that for every active rig in the U.S. today roughly 2700 barrels of oil are produced. This is a far cry from the 5900 daily barrels per active rig at the beginning of 1973.

image

Figure 4:  Ratio of U.S. footage drilled for crude oil, natural gas and dry exploratory and developmental wells (thousand feet) to active rigs, January 1973 to January 2012.

Figure 4 shows that the ratio of footage drilled of all types to active rigs has steadily increased since 1998. This is a combination of both drilling deeper and less exploratory wells being converted into active rigs. It can costs hundreds of dollars per foot to drill so we can see that the U.S. is coming up against increasing inefficiencies with drilling to active rig conversion.

Figures 3 and 4 show that it is without a doubt that the fields being tapped today are of a far lower quality. This means far more capital must be invested in order to produce the same amount of oil as 40 years ago. With the U.S. and global economy still on very shaky ground it is questionable as to where this capital will come from. There are already concerns being raised over a labour shortage in the U.S. oil industry. 

Well Servicing Magazine reports that:

“There are just not enough experienced work crews to staff many more rigs coupled with various areas of the country that do not want drilling or servicing rigs working in their backyards.

No one knows how rig counts will react any more. There is only so much iron the oil patch can handle. Rigs and tubular goods cannot materialize that fast. There might be a gradual trend upward, but it’s a slow process. The reality is that rig counts can go down much faster than they can go up.”

So even if there was no looming labour and capital crisis how soon could the U.S. gain oil independence based on current growth figures?

image

Figure 5: Projected U.S. crude oil production (including lease condensate) based on he trend from January 2009 to February 2012.

The U.S. currently consumes 19,500,000 barrels of oil per day. If we assume that U.S. oil consumption stays the same it will take 80 years for the U.S. to reach oil independence based on the production trend from the last three years (Figure 5), unless the active rig count increases dramatically which as we have seen above is unlikely in the current economic climate. If the U.S. hopes to grow its economy in any real sense (financial abstractions in the tertiary economy don’t count) it is clearly a ridiculous assumption that  oil consumption will not grow at the same time.

As with all future predictions only time will tell. But I am willing to bet that the only way that the U.S. will gain oil independence is by the economy contracting and jobs being lost. This is clearly not a winning platform for politicians to gain votes and so we will continue to see these Polyannaish statements based on little more than hope that the U.S. is on the brink of an energy revolution. The hard facts are more difficult to argue with but that won’t stop those trying to gain office and favour with the oil industry from promoting the idea of business as usual. Let’s hope they wake up before things get really bad.  

Wednesday, May 2, 2012

Building Highways To Nowhere: Transport Planners Refuse To Acknowledge Peak Oil

James Henderson at The Standard has kindly given permission to syndicate this post - the original is found here.

Holiday Highway Even Less Affordable

The case for the Puhoi to Wellsford Holiday Highway just got even worse. Before, officials reckoned it would return net benefits worth ten cents for every dollar spent. Now, the cost will equal the benefits – if traffic volumes double in 15 years. Problem is, traffic volumes in Northland are flat or falling in the Peak Oil Age.
It’s actually worse than that. The Puhoi to Warkworth segment will supposed have a 1.5 benefit:cost ratio if traffic volumes double (NZTA grades anything below 2 as a “low” return on investment) but Warkworth to Wellsford will have a BCR of 0.6. That’s right, for every dollar you sink into it, you get 60 cents worth back. That’s worse than what you can expect from SkyCity’s pokies. 

And both these crappy returns on investment are based on an unrealistic model for traffic growth. The amount of traffic matters because the main ‘benefit’ of the Holiday Highway is meant to be getting trucks from Northland to Auckland a few minutes faster, avoiding congestion they would face if the existing road had to handle double the traffic. But, if that congestion never materialises, neither does the value in having a new highway alongside the existing one. 

Here’s how traffic volumes are tracking in Warkworth with NZTA’s assumed 2026 volume for comparison to the trends: 


NZTA’s modellers seem to be working with a pre-peak oil model, wherein traffic growth will continue permanently and swiftly. In the real world, however, traffic volumes are stagnant. How bad does the BCR get if you cut the traffic volume in 2026 by 15,000 – in line with peak oil reality? 

As for the second segment up to Wellsford. If you didn’t think it was a waste of money already: 


If you live up in Northland, it might be nice to have a billion dollar highway down from Wellsford to Warkworth, and a $760m one from there to Puhoi. But, we live in a constrained world – we don’t have money and resources for every option. The traffic volumes shown in those graphs are pretty typical for the main drag in a small town astride a state highway, and they’re not growing significantly. 

I’m afraid that highways that are only just worth their own cost of construction if miraculous traffic growth is assumed ought to be one of Bill English’s ‘nice to haves’. There are more effective uses for that money that will help more people.
Newer Posts Older Posts Home